Driving Ardent Innovation Series: Prometheus and Grafana
14 April 2023 | Noor Khan


In our new series ‘Driving Ardent Innovation’ we cover some of the tech hacks, discoveries and POCS our R&D team make. We are committed to continuous innovation so we support and encourage our R&D teams to explore and learn technologies that will enable us to better serve our clients. In this edition, we will be looking at two powerful SRE and DevOps technologies - Prometheus and Grafana project led by Salim Khan, Senior Data Lead.
Prometheus and Grafana are two powerful technologies which can be leveraged for intelligent, automated monitoring and alerting of applications and data. We will dive into our findings.
What is Prometheus?
Prometheus is an open-source monitoring and alerting system which was created by SoundCloud in 2012. It is one of the most popular technologies on the market and has a market share of 8.15% according to Datanyze. The software collects pre-defined metrics from multiple systems including applications, databases and infrastructure and they are then stored in a time series database.
Prometheus features
There are a number of features which make Prometheus the ideal choice for monitoring and alerting and they include:
- Multi-dimension data model – With the ability to connect to a wide variety of data sources.
- Use of PromQL – Powerful query language which is similar to SQL and is used for data collection and feeding data into Grafana for visualisation.
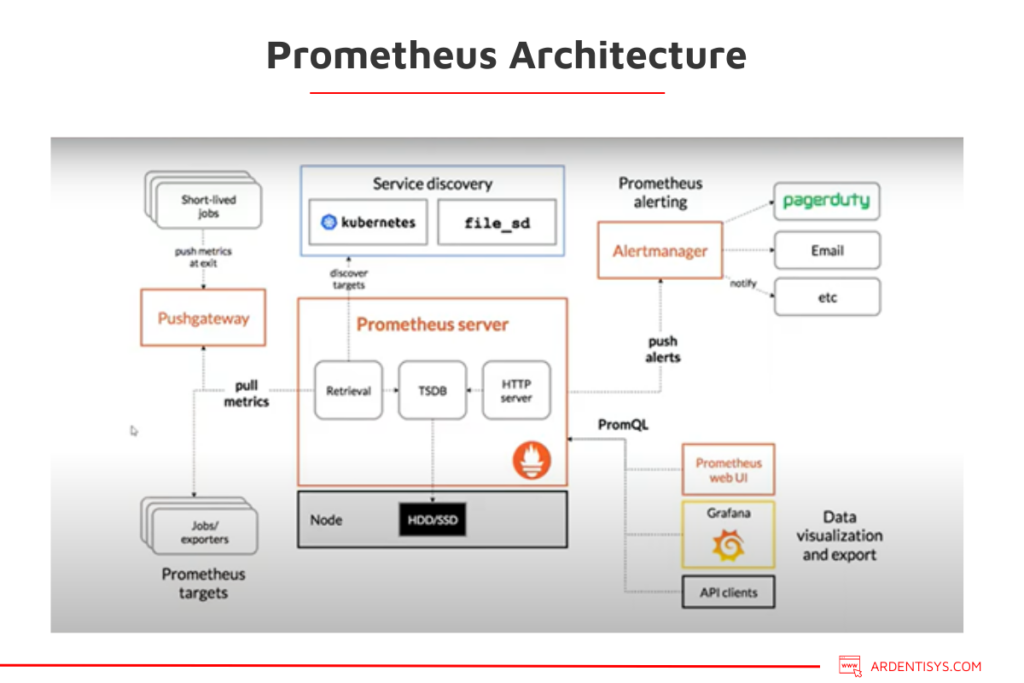
- Pull-based architecture – indicators are obtained actively as opposed to systems pushing indicators
- Alerting – With Alert Manager, alerts are sent to preferred channels such as email, PagerDuty or OpsGenie.
“Prometheus is one of the leading technologies in the DevOps space and is widely used across the industry. I think what makes it so popular is the high speeds it delivers data collection as well as the wide variety of data sources it can connect to. I have found that there are a lot of highly skilled DevOps engineers who are proficient in Prometheus and adopt it as part of their DevOps tech stack” – Salim Khan, Senior Data Lead
What is Grafana?
Grafana is an open-source data visualisation software which is often integrated with Prometheus for powerful monitoring, alerting and reporting solutions. Users can query, visualize and alert on metrics and logs as well as define alert rules based on the data collected. Grafana is a powerful technology which can be connected with a wide range of data sources, and it can send alerts to multiple channels such as Slack, PagerDuty and email.
Grafana features:
- Customizable dashboards – these can be customised based on specific requirements and needs
- Simple visuals – Easy to understand, user-friendly visualisation
- Prometheus integration – Easily integrate with Prometheus
Prometheus and Grafana POC (Proof of Concept)
To put these technologies to the test, Salim set up infrastructure monitoring of the AWS EC2 machine which collects data on a real-time basis. To start with Prometheus, Exporters and Grafana Server were installed to collect the data from the EC2 machine.
With Prometheus, you are provided with a local host UI, which is where you can see the data being monitored, and set up alerts, rules, targets and more.
Prometheus can handle large volumes of data which makes it a remarkable technology.
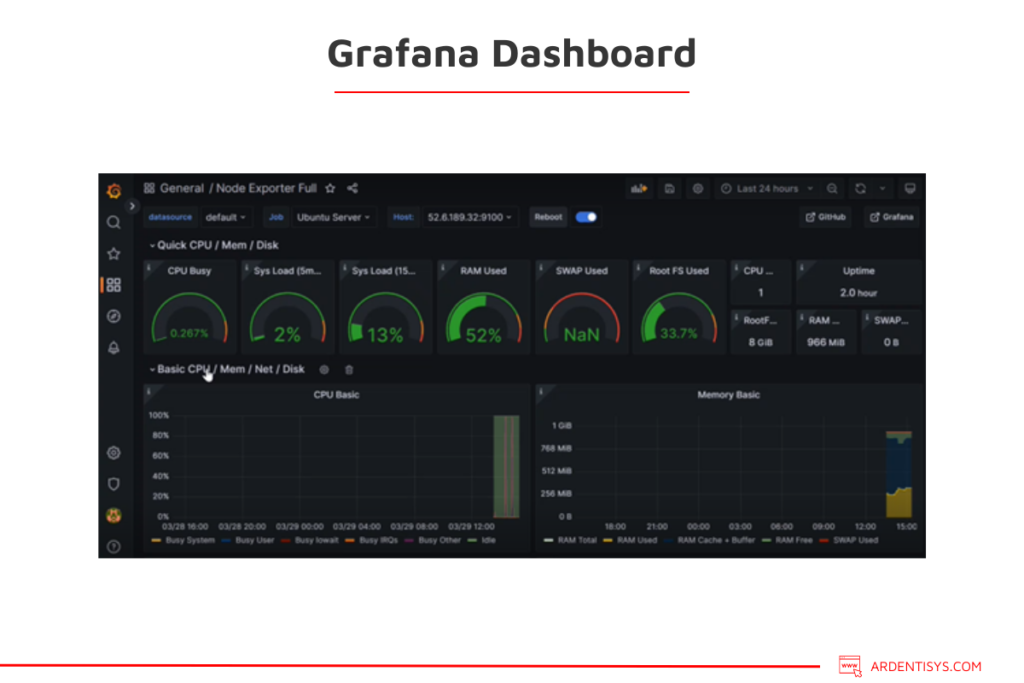
It is then a simple case of integrating Prometheus with Grafana to start visualising the data. With the ability to create dashboards, and customise existing templates, Grafana is considered easy to use. With your customised dashboard, you can then visualise the performance of the EC2 machine in real-time. Some of the metrics we measure and monitor are CPU utilization, RAM used, Sys Load, and SWAP used.
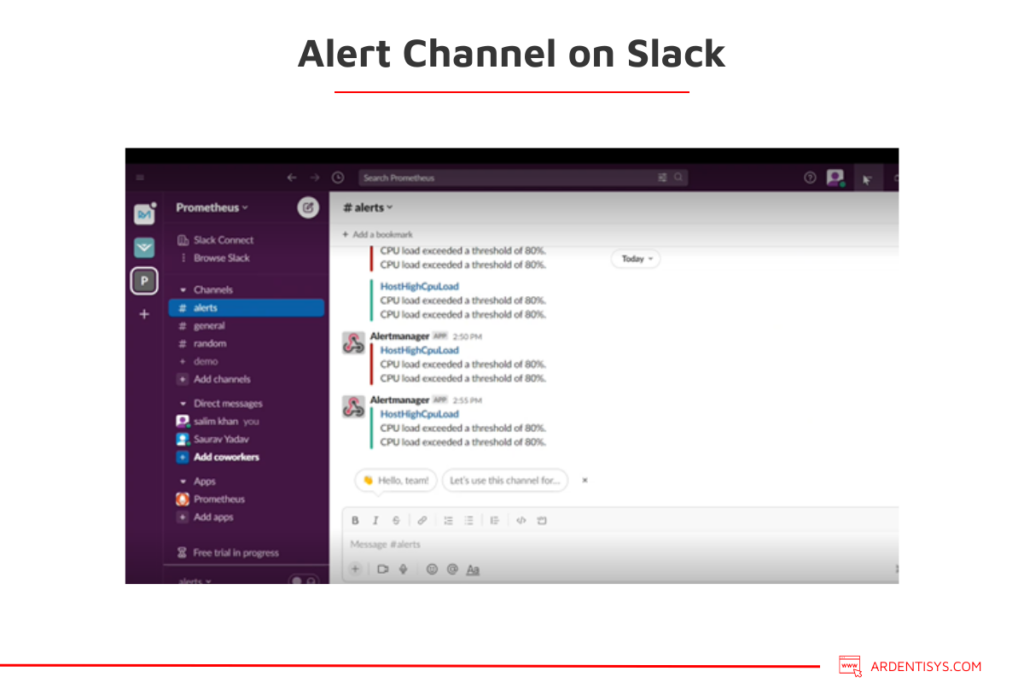
Additionally, we have created alerts to be fired when the CPU surpasses the 80% threshold. This alert is then communicated via multiple channels such as Slack and email.
We created a specific ‘Alerts’ channel for the alerts, keeping the communication clear and visible to all relevant parties.
"Prometheus is usually most often used for data collection, whereas Grafana is better suited to data visualisation. Both together, provide a powerful data monitoring and visualisation solution”.
Salim Khan, Senior Data Lead
Prometheus and Grafana use cases
There are many use cases for the combination of these technologies and they include:
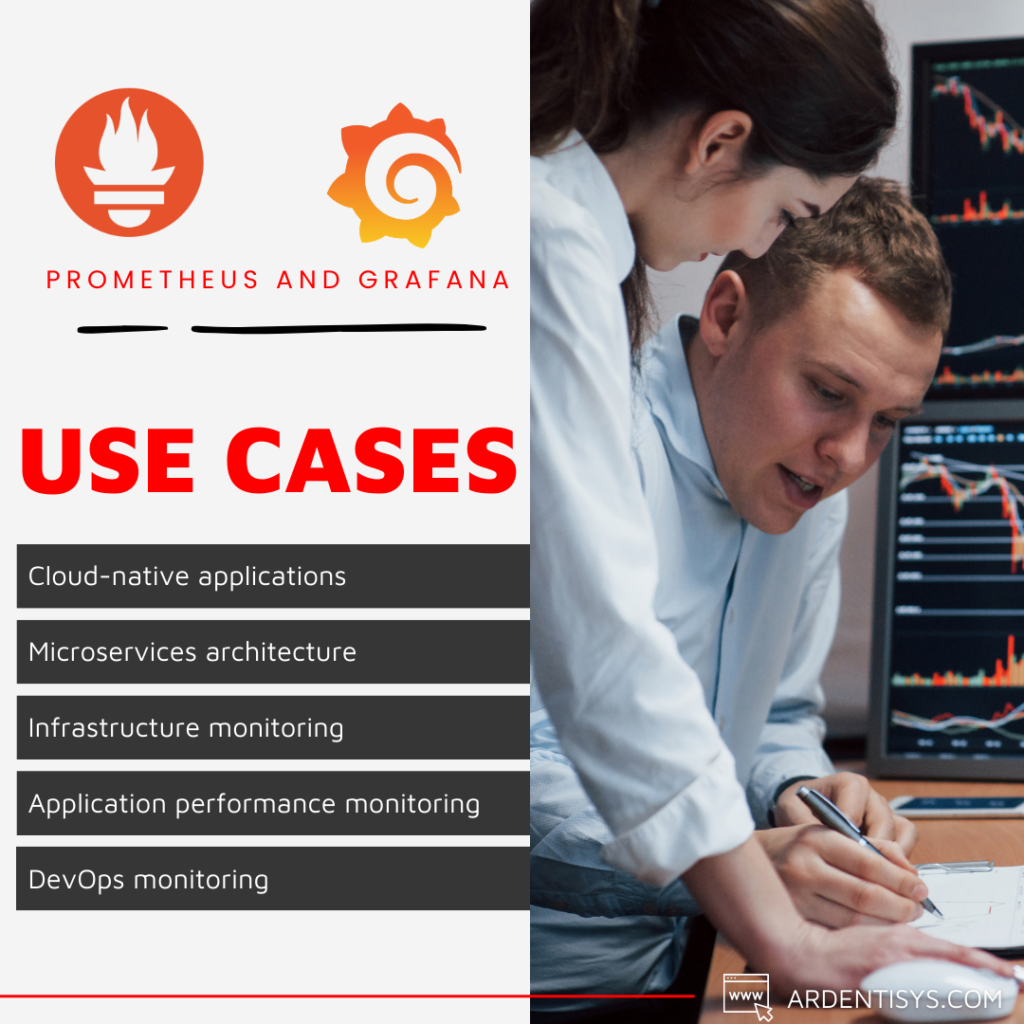
Cloud-native applications
Prometheus is well-suited for monitoring cloud-native applications that are deployed using container orchestration platforms such as Kubernetes or Docker Swarm. It provides out-of-the-box support for Kubernetes and has several exporters that make it easy to monitor various components of the platform.
Microservices architecture
With its support for multi-dimensional data and service discovery, Prometheus is an excellent choice for monitoring microservices architectures. It allows users to monitor individual services as well as the overall health of the system.
Infrastructure monitoring
Prometheus can be used to monitor various components of the infrastructure, including servers, databases, and network devices. It has several exporters that make it easy to monitor different types of infrastructure components.
Application performance monitoring
Prometheus can be used to monitor the performance of applications by collecting metrics such as request latency, error rate, and throughput. It can help identify performance bottlenecks and troubleshoot issues quickly.
DevOps monitoring
With its support for alerting and integrations with other tools, Prometheus is an excellent choice for monitoring DevOps workflows. It can help identify issues early in the development cycle and improve the overall reliability of the system.
Ardent, committed to continuous innovation
We know technology does not stay still so we do not either. We are committed to keeping on moving with continuous investment in innovation and evolution so we encourage and support our people to explorw new technologies to continuously learn and improve. R&D is at the forefront of the Ardent way. Explore how our clients are succeeding with innovative technologies:
- Improving data turnaround by 80% with Databricks for a Fortune 500 company
- Robust, scalable data pipelines with AWS infrastructure for powerful insights
If you are looking for a DevOps solution with a provider that is committed to continuously bringing you the best in the industry, get in touch to find out more or to get started.
Ardent Insights
Which Platforms Are Ahead in AI-Ready Data Pipelines?
At Ardent, we have spent years helping organisations design, modernise and operate the data foundations behind critical reporting, analytics and decision-making. That experience gives us a clear view of what now separates AI-ready businesses from those still struggling to get value from their data. It is not the amount of data they hold, or even [...]
Read More... from Driving Ardent Innovation Series: Prometheus and Grafana
Making Your Existing Data Pipelines AI-Ready
From Stable Infrastructure to Adaptive Intelligence Most organisations do not need more data. They need their existing data to work better. At Ardent, we spend a significant amount of time inside large-scale client data platforms that are already mature, operational, and delivering value. These are not greenfield environments. They are complex ecosystems built over years, [...]
Read More... from Driving Ardent Innovation Series: Prometheus and Grafana
AI-Powered ETL in Amazon Redshift
When the Warehouse Starts Doing the Work In our previous piece, we explored how ETL (Extract, Transform, and Load) is evolving into adaptive, intelligent systems. In Redshift environments, we are now seeing what that shift looks like in practice. For most of its life, Amazon Redshift has been treated as the final step in the [...]
Read More... from Driving Ardent Innovation Series: Prometheus and Grafana

Services
About
UK
US
India

