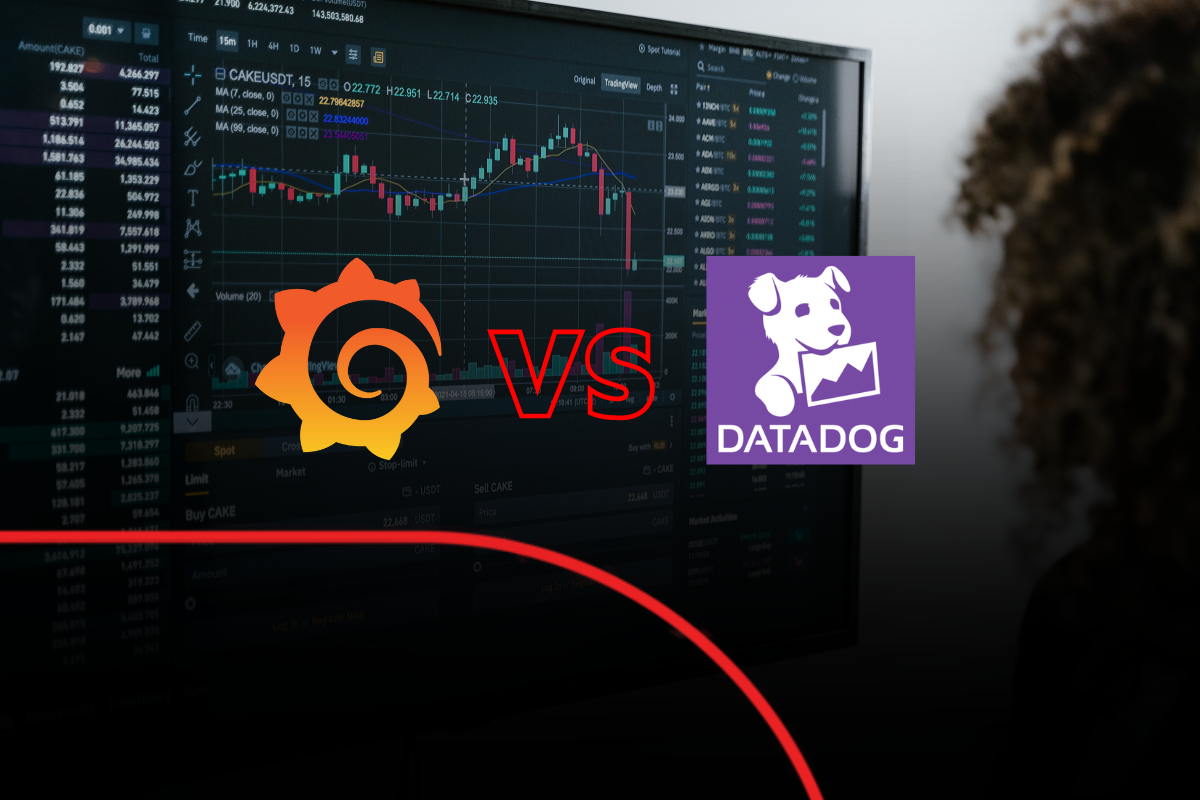
Comparing Grafana and Datadog: What’s the top choice for 2023?
16 May 2023 | Noor Khan


Technology continues to evolve at a rapid pace, and companies are finding that if they do not get ahead of the need to update and upgrade, they are losing valuable data and opportunities, which their competitors are picking up instead.
97.2% of companies say that they are investing in big data and AI projects, and although only 24% would describe their organisations as being ‘data-driven’, the use of operational monitoring is increasing as access to new levels of data and insights are proving to be invaluable in collating data for deep dive reviews into business performance, operations, customer behaviours and habits, and so much more.
Businesses that have adopted data-first approaches, such as those utilising DevOps technologies have a number of different platforms and applications to help their monitoring and management, two of the most popular include Grafana and Datadog.
We are going to look at both of these platforms – their strengths and weaknesses, and how they compare, to help you determine whether these platforms are the best choice for your tech needs.
The benefits and drawbacks of Grafana
Grafana was first released in 2014 and is an open-source interactive data-visualisation platform. It is a tool for running data analytics, with the help of established metrics, to give insights into complex infrastructure and large amounts of data.
Technologies used by or with Grafana include:
- Prometheus
- MySQL
- Azure Monitor
- Amazon CloudWatch
- Graphite
- InfluxDB
- Elasticsearch
Pros of Grafana
- Metrics are well visualised, and colour co-ordination make it easy to use.
- If a threshold is breached, the platform will send an alert to collaboration channels.
- Platform has high levels of flexibility and versatility.
- Panels on the dashboard are ‘drag-and-drop’ to allow additional customisation, along with the initial dashboard configuration.
- Works well as a companion tool with other integrated data analytic programs.
Cons of Grafana
- Set-up can be time consuming and challenging due to the wide level of customisation available.
- No data storage and can only use data from external systems.
- Data collection is dependent on other systems.
- Limited types of data visualisation.
The benefits and drawbacks of Datadog
Datadog was founded in 2010 and is an observability platform, and a monitoring and analytic tool for IT and DevOps teams to determine performance metrics, event monitoring (for infrastructure and cloud services), and monitoring of servers, databases and tools.
Technologies used by or with Datadog include:
- Amazon Web Services (AWS)
- Microsoft Azure
- Grafana
- Kubernetes
- Elasticsearch
Pros of Datadog
- Popular choice with cloud-native startups.
- UI is powerful and configurable.
- Setup is relatively easy.
- Allows for streamlining of monitoring DevOps team stack apps and provides full visibility over modern apps.
- Offers a free trial for an unlimited number of hosts.
- Provides more than 200 turn-key integrations for data aggregation.
- Utilises a single console for everything related to monitoring.
- The Simple Rest API allows for integration with a wide range of services and applications.
Cons of Datadog
- With so many separate features combined to customise the user experience, there can be inconsistencies in feature availability and performance.
- The reports and graphs can be difficult to understand due to their highly technical nature.
- No mobile app available.
- Cloud-only option, making it unsuitable for hybrid businesses.
- Not primarily targeted towards monitoring routers or network hardware.
- Detection of devices is not automatic.
- Price can be comparatively more expensive compared to other competitors.
How do Grafana and Datadog compare?
Both platforms offer significant benefits when utilised for the right tasks, and although they share some similarities, there are considerable differences between both tools.
| Grafana | Datadog | |
| Operational monitoring | Dashboard and plugin can be connected to multiple sources and provide a wide overview of the business. | The platform provides a wide range of metrics and data that allow for monitoring and troubleshooting of business infrastructure. |
| User Experience and Dashboard | Open-source platform allows for tool integration and configuration, to highly customise the experience. | Dashboards can be created and customised to provide an overview and monitoring of information required by the user. |
| Price | Free for use, however cost of data storage and networking must be considered, and there is an option to use the GrafanaLabs paid cloud plans. | Price varies depending on the tier, and the functionality required. |
| Key Features | Grafana is known for its flexible dashboards, extensive plugin offerings, central UI, and alerting system. | Datadog is known for its application performance monitoring, security monitoring, log management, network monitoring, and real user monitoring. |
| Usage | Often considered to be a good solution for meeting existing business needs. | A popular choice for providing ongoing product support. |
Making an informed choice between Grafana and Datadog
Depending on your needs, budget, and how your team is set up – either tool could be a useful addition to your arsenal and improve your ability to effectively manage your operational monitoring, DevOps and data management needs.
When considering your choice, there are a number of questions that you should ask yourself:
- Does the tool cover the relevant tasks I need of it now?
- Will it be suitable for the direction the company is headed in, and future needs?
- Can I monitor the analytics that I need to?
- How well supported are the options I am looking at?
- Do my team know how to work with the tools, or will they need extensive training?
- Does the functionality meet my needs and my budget?
Whether you are working in-house or bringing in an outside team of professionals to help you with your data engineering and managed services, it is important that the tools for the job are working for what you need, and you are not having to try and ‘make do’ with restrictions and limitations that could lead to lower productivity, higher costs, and less quality as a result.
Operational monitoring and support with Ardent
If you are unsure of which tool is right for you, or would like to discuss your technology needs, we are happy to provide you with assistance and advice, to help you and your company make the most of your data and the technology, tools, and platforms available. Discover how our clients are able to maximise the potential of their data with Ardent:
- Ensuring timely data availability for real time, mission critical data
- Trust your data availability with expert operational monitoring and support
Gain a peace of mind with your data and systems handled by experts by getting in touch today.
Ardent Insights

Which Platforms Are Ahead in AI-Ready Data Pipelines?
At Ardent, we have spent years helping organisations design, modernise and operate the data foundations behind critical reporting, analytics and decision-making. That experience gives us a clear view of what now separates AI-ready businesses from those still struggling to get value from their data. It is not the amount of data they hold, or even [...]
Read More... from Comparing Grafana and Datadog: What’s the top choice for 2023?
Making Your Existing Data Pipelines AI-Ready
From Stable Infrastructure to Adaptive Intelligence Most organisations do not need more data. They need their existing data to work better. At Ardent, we spend a significant amount of time inside large-scale client data platforms that are already mature, operational, and delivering value. These are not greenfield environments. They are complex ecosystems built over years, [...]
Read More... from Comparing Grafana and Datadog: What’s the top choice for 2023?
AI-Powered ETL in Amazon Redshift
When the Warehouse Starts Doing the Work In our previous piece, we explored how ETL (Extract, Transform, and Load) is evolving into adaptive, intelligent systems. In Redshift environments, we are now seeing what that shift looks like in practice. For most of its life, Amazon Redshift has been treated as the final step in the [...]
Read More... from Comparing Grafana and Datadog: What’s the top choice for 2023?
Services
About
UK
US
India

