4 SRE metrics you should absolutely be measuring
26 April 2023 | Noor Khan

Site Reliability Engineering (SRE) is a set of practices and principles that bring together software engineering and IT infrastructure in order to create highly reliable and scalable software systems.
Of course, if you want to achieve this goal, you need to know exactly what is being done, what is going on, and how your processes are performing before, during, and after the upgrade to a SRE approach.
Amongst IT organisations, 55% use SRE within specific teams, products or services, and SRE is growing in popularity as a means of ensuring maximum efficiency, and although there may be challenges in using the method, expert insight makes these relatively easy to resolve in order for a company to truly benefit from SRE.
SRE services are generally responsible for managing large systems and improving the development lifecycle of software, and this is done through a variety of tools and processes.
To ensure that your SRE processes are operating at maximum capability, and bringing you the results you expect, there are four key metrics that you need to monitor:
Latency
This refers to the time it takes to serve a request, and it may be tricky to get an accurate reading if your first impulse is to measure the overall average latency of your system.
This is because there may be very fast requests, or very slow requests, which distort the results, and could mean that one measurement seems significantly different from the others, not because the system is improved or failed – but simply because the request was not running when the previous results were gathered.
It is recommended that latency is considered in percentile, using a median to measure how the fastest 99%, 95%, or 50% of requests (respectively) took to complete. Once you have these figures, you can then determine a more accurate response time to requests, because the average time for each percentile will not be influenced by individual tasks that fall in a different group.
When measuring latency, it is also important to consider the status of the request – was it successful, or did it fail? Failed requests may take less time than correct ones, but a large number of failed requests is indicative of a problem that is unrelated to the speed of the process.
Traffic
This metric looks at the amount of use that your service is under, per time unit. This not only allows you to see when you have the highest amount of usage (and when), but also to determine if there are any anomalies - if, for example, you are used to seeing high usage time at 13:00 on a Monday afternoon, but your recent data shows a significant drop-off at this time, it may be due to issues, errors, or even project completion – which then may change the way in which you use the service, and how you queue up your requests.
How you measure your traffic will depend on what you are doing, but you may consider looking at:
- Queries per minute for database applications
- Requests per minute for web-based applications
- Endpoint requests per minute for Application Programming Interfaces (APIs).
When measuring any traffic, a corresponding timecode or reference should always be applied, in order to make the best use of the information.
Errors
This metric relates to the rate at which requests fail and requires a careful approach in order to prove useful. For example, measuring the bulk amount of errors may seem like a logical approach, but if you have recently seen a peak in application requests, then it would be logical to assume that the number of failed requests would increase as well – which would skew the results and inflate them.
In most cases, monitoring systems will focus on calculating the error rate as a percentage of those that are failing from the total. For those utilising web applications, these errors may be further broken down into client errors or server errors.
When upgrading or updating a platform or program, it is useful to record the number of errors before rollout, and then again afterwards – taking into consideration any extra requests or usage that the upgrade is expected to bring – in order to determine whether an upgrade has been effective in reducing the number of related errors.
By making data science efficient with high data availability, it is possible to reduce the number of errors that cause delays in key areas, and knowing how and where the errors are occurring is the first stage in achieving this.
Saturation
This metric is involved with measuring your system resources, and how they are being utilised. The results will often be determined as a percentage of the maximum capacity for each element.
Areas that could be monitored to gather data for this metric include:
- Network bandwidth
- Memory usage
- CPU usage
- Disk space
Companies who are using cloud applications on their machines may find that their numbers are considerably smaller compared to those who are using on-premises resources.
In order to make the best use of Saturation metrics, it is important that outside considerations are addressed – specifically, what would happen if the resource were to be fully used or unavailable?
The saturation of a business resource is a crucial element for monitoring, as it affects what projects can be taken on, how often a resource can be used, whether there is too much or not enough of a particular resource, and whether there is over or under spend in that area.
How often should you monitor your metrics?
In order to improve performance and ensure that you are making the most of your resources, it is essential that metrics are measured and recorded on a regular basis – for some high use programs or apps, this could be as often as weekly (especially if you are working on updates and rolling out new processes that require careful adjustments to complete).
Other metrics could be measured monthly, quarterly, or yearly, depending on their usage levels, importance, and how often they are being upgraded.
Determining the optimum time for measurement will largely depend on your project, and what goals you are aiming to achieve with your monitoring. You may also wish to combine your monitoring with other monitoring strategies to gain a fuller picture, not only of how your SRE is working, but how your data is being utilised and stored.
Your SRE, powered by Ardent
At Ardent, we provide complete SRE solutions to ensure our clients have reliable, available and consistent systems, whether that is applications or data infrastructure. Working to agreed SLAs, our Site Reliability Engineers will communicate with you on the agreed frequency and communication channels to keep you in the loop, whilst ensuring maximum uptime. Read how our customers are thriving with Ardent SRE services:
Monetizing broadcasting data with timely data availability for real-time, mission-critical data
Making data science efficient with expert operational monitoring and support
If you are looking to 24/7 peace of mind, knowing your data and systems are being handled by expert, get in touch to find out more or explore our operational and monitoring support services.
Ardent Insights

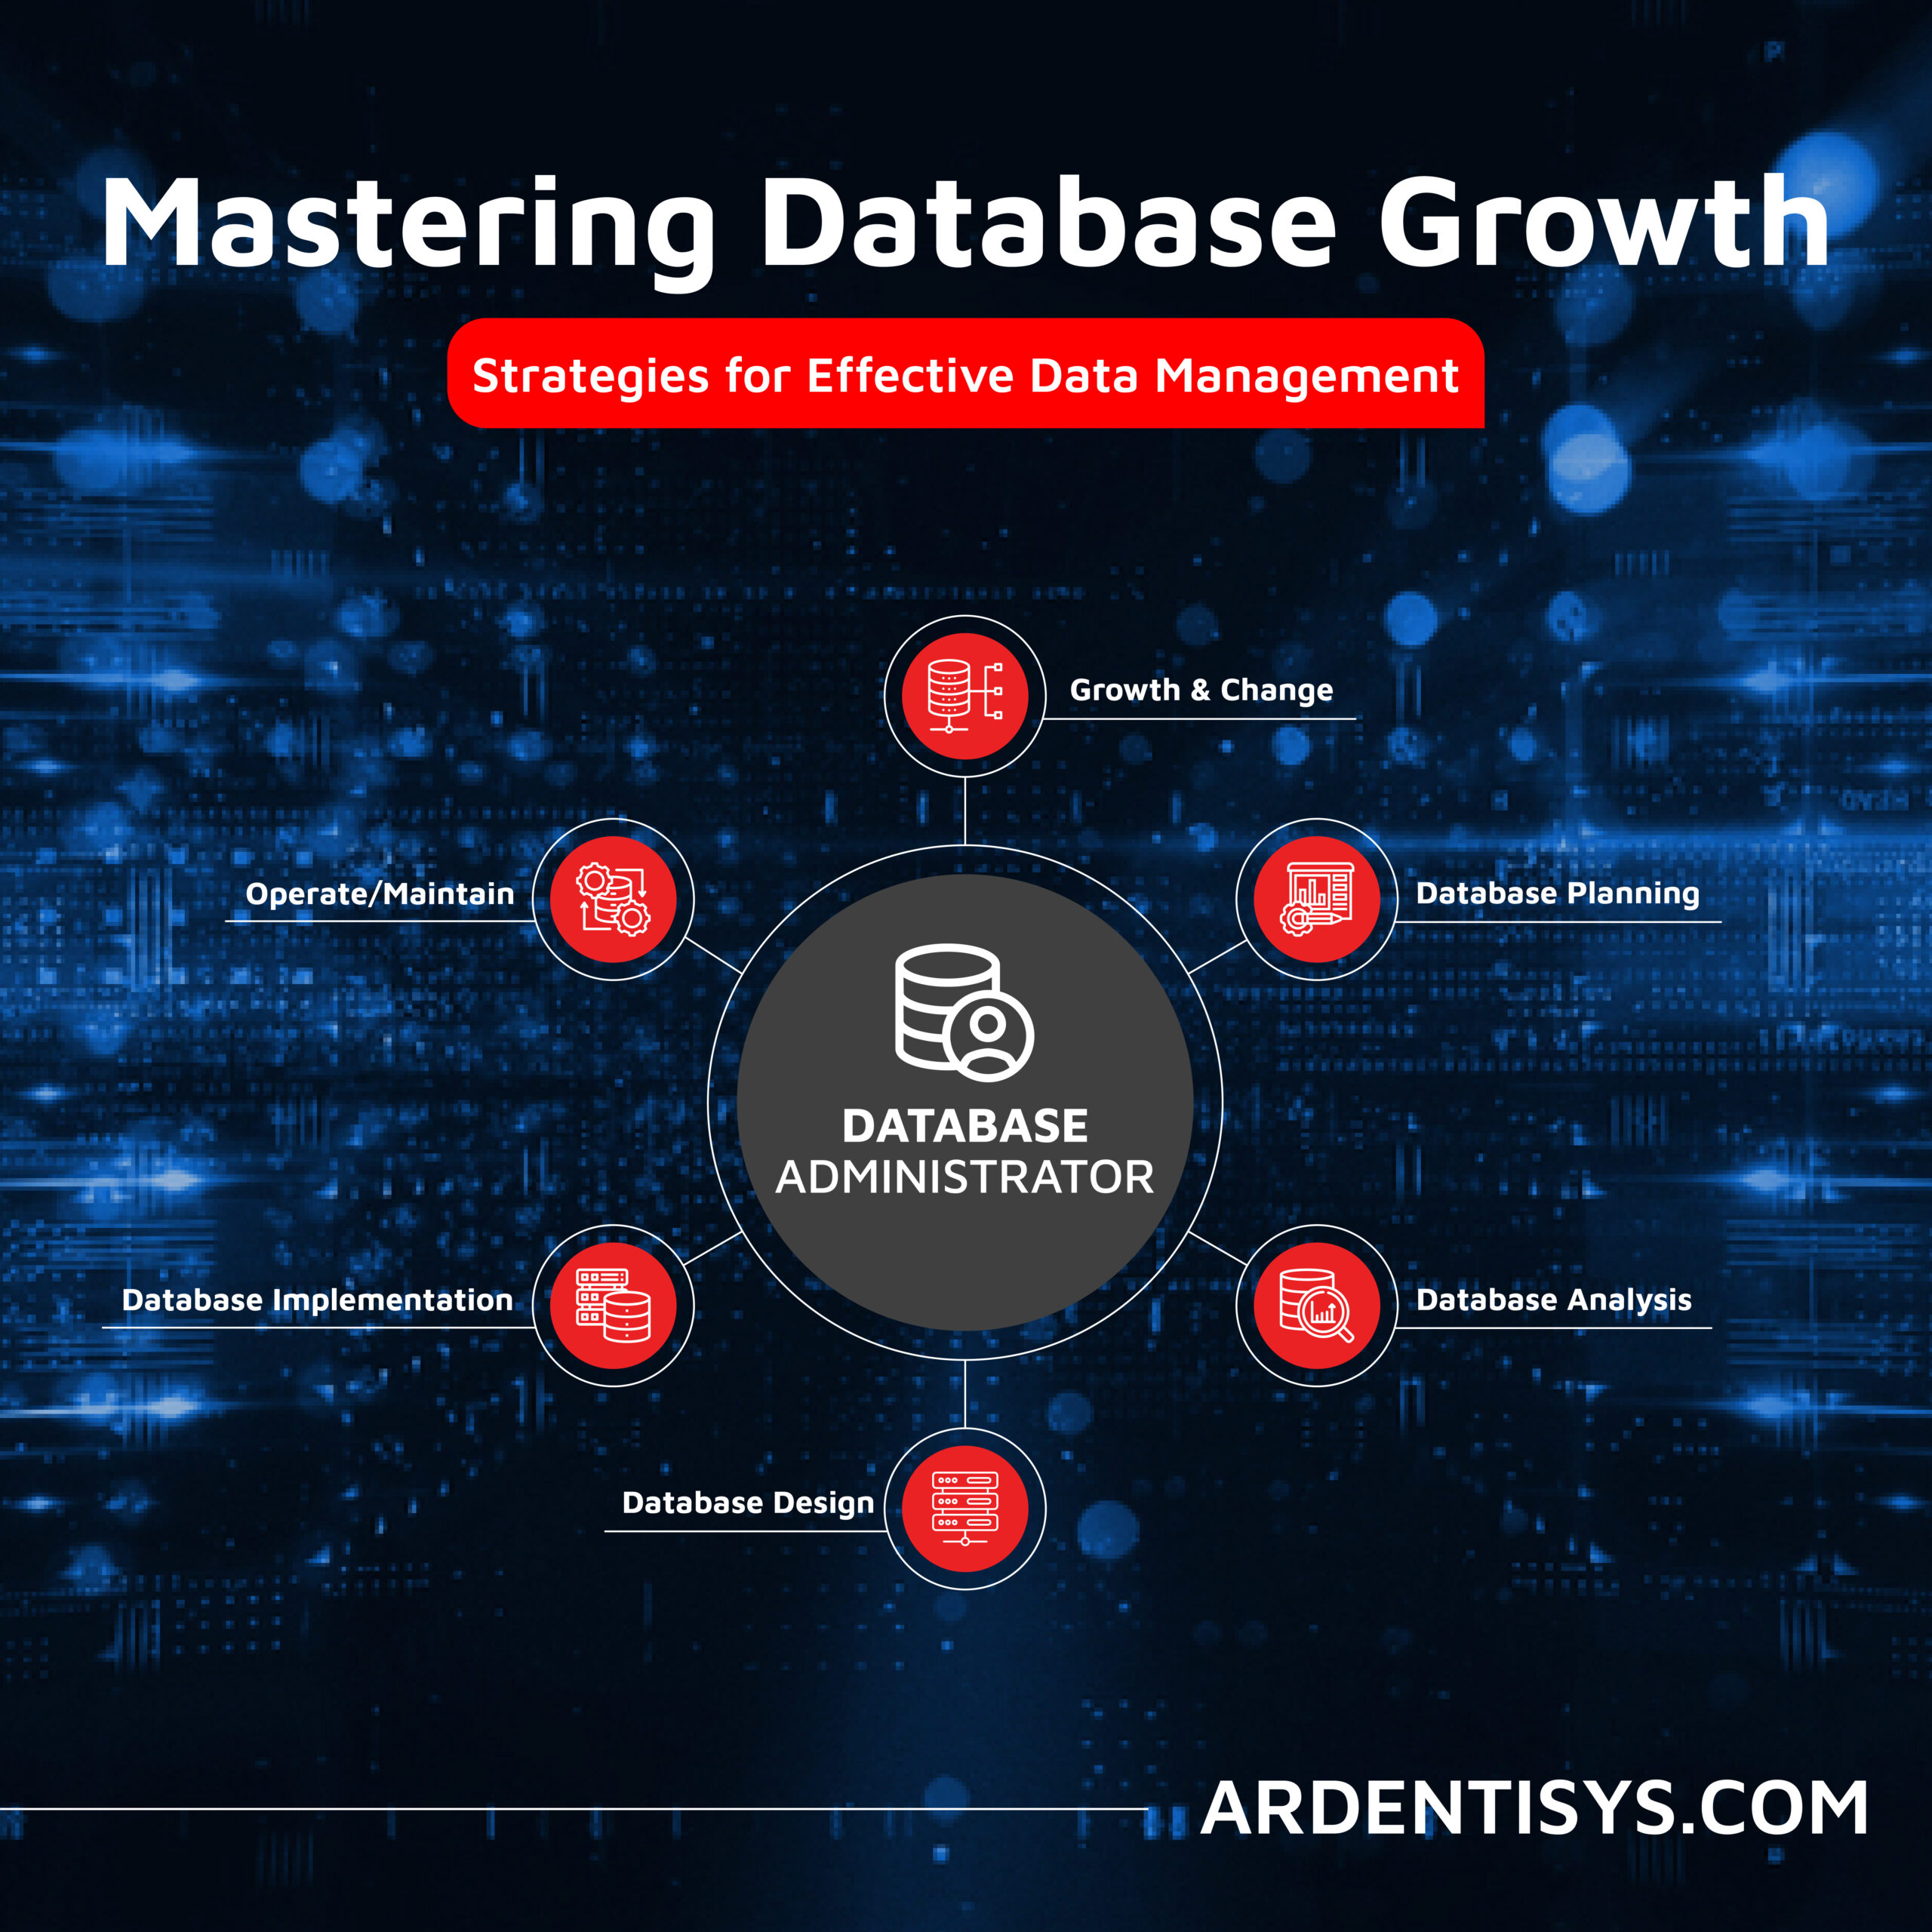
Overcoming Data Administration Challenges and Strategies for Effective Data Management
Businesses face significant challenges to continuously manage and optimise their databases, extract valuable information from them, and then to share and report the insights gained from ongoing analysis of the data. As data continues to grow exponentially, they must address key issues to unlock the full potential of their data asset across the whole business. [...]
Read More... from 4 SRE metrics you should absolutely be measuring

Are you considering AI adoption? We summarise our learnings, do’s and don’ts from our engagements with leading clients.
How Ardent can help you prepare your data for AI success Data is at the core of any business striving to adopt AI. It has become the lifeblood of enterprises, powering insights and innovations that drive better decision making and competitive advantages. As the amount of data generated proliferates across many sectors, the allure of [...]
Read More... from 4 SRE metrics you should absolutely be measuring

Why the Market Research sector is taking note of Databricks Data Lakehouse.
Overcoming Market Research Challenges For Market Research agencies, Organisations and Brands exploring insights across markets and customers, the traditional research model of bidding for a blend of large-scale qualitative and quantitative data collection processes is losing appeal to a more value-driven, granular, real-time targeted approach to understanding consumer behaviour, more regular insights engagement and more [...]
Read More... from 4 SRE metrics you should absolutely be measuring


