Popular data analytics and reporting tools
7 June 2022 | Noor Khan



Businesses around the world are becoming data-driven and making smart decisions based on their data. They do this by leveraging innovative technologies that help them make sense of large sets of complex data. According to Future Business Insights, the global big analytics data market is worth USD 231.43 billion in 2021 and is predicted to grow to USD 549.73 billion by 2028. As organisations continuously look to understand their data and leverage insights to better serve their markets, the right data analytics and reporting tools have to be used.
Here we will look at some of the most popular data analytics and reporting tools on the market including Tableau, Microsoft Power BI, Periscope and Pentaho. Ardent engineers have worked with all these technologies for various client projects and have found many incredible benefits and some limitations.
Tableau
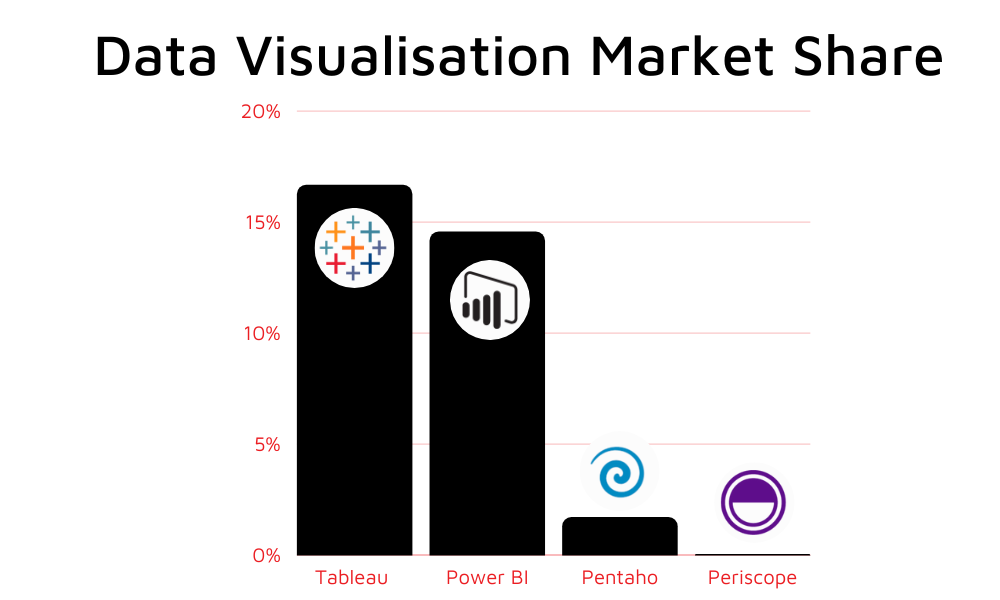
Tableau has been around for almost two decades, helping people see and understand their data. According to Slintel, Tableau is the market leader in data visualisation with a 16.66% market share. Tableau offers stunning, easy to understand visuals of large volumes of data, enabling users to gain an understanding of their data. Tableau presents complex raw data in an understandable format for any professional in an organisation, making it versatile and incredibly useful to an organisation that may not have in-house data scientists. However, Tableau can be considered costly compared to some platforms in the market.
Ardent’s data engineers have worked with Tableau on a number of occasions to implement and enhance data reporting, particularly for our clients in industries such as market research, manufacturing and pharmaceuticals.
We will look at some advantages on offer and some limitations that come with Tableau.
Advantages
- Stunning visuals – Tableau is known for its outstanding visuals of data making it a leader in its field.
- Easy to use – Expert skills are not required to create graphics and visuals of data within the software.
- High performing – Tableau is a robust tool that can handle larges volumes of data most organisations deal with.
- Extensive data connectors – You can collect a wide range of data sources from file systems such as Excel and CSV to relational systems such as SQL Server, and Oracle to cloud systems such as Azure.
- Robust mobile app – Tableau offers an efficient, user-friendly mobile experience allowing users to access their data and reports as and when needed.
Limitations
- Costly – Although it’s not the most expensive data reporting and analytics tool it can be costly when it comes to implementation and training. Additionally, license costs can be expensive for businesses on the smaller scale.
- Lack of importing – You are not able to import visuals that have been created compared to other competitors such as Power BI.
- Requiring data cleansing – Tableau is a visualisation tool therefore the data needs to be cleansed beforehand before it can go through the visualisation phase.
Microsoft Power BI
Microsoft Power BI come second only to Tableau with a market share of 14.56%, according to Slintel. Power BI has established itself as one of the leading technologies in data analytics and reporting with a presence in over 189 countries and 50,000 customers. It’s great for organisations that may already be using other Microsoft technologies such as Azure, Excel and SharePoint, enabling businesses to collate and visualise their data.
Ardent has worked with Power BI on a number of projects including a performance management system built with the Power Platform.
Here are some advantages and limitations to consider if you are looking to invest in Microsoft Power BI.
Advantages
- Attractive visualisations – You can create a range of visualisation as simple or as complex as you require for your dataset. Visualisation types include scatter charts, pie charts, filled maps, funnel charts and more.
- Microsoft technology – Backed by one of the leading technology providers in the world, Power BI will likely have continuous investment and improvement.
- Data connectors – Currently 116 data sources are listed as connectors, this include the likes of AWS (Redshift, Athena), Azure (Databricks, SQL Database), Dynamics 365, Excel, Hadoop, MySQL, Power Platforms and many more. Find the complete list of Power BI data connectors here.
- Try before you buy – Power BI offers a free version, which can give organisations of all sizes a trial run before they invest in the platform.
- Natural language – A unique feature of Power BI is the natural language Q&A box which allows users to carry out searches in natural language to search for data, visualisations or reports.
Limitations
- Inflexibility in visuals – Power BI does not allow you to configure your visuals as per your requirements, although the standard may be enough for you.
- Busy User Interface (UI)– A number of users have found the UI to be quite busy and cluttered.
- Manual work – Developers are not able to automate repetitive processes with code.
- Complexity of use – Some consider the tool to be quite complex, with several components on offer such as Power BI Desktop, Power BI Gateway and Power BI services, it can be difficult to understand what is on offer.
Get the expert insights on the new Power BI
Periscope
Periscope is a much smaller technology platform compared to the like of Tableau and Microsoft Power BI with a market share of 0.05%, according to Slintel. However, we have used Periscope both internally for our client services as operation monitoring and support and for client projects to provide end to end data reporting solutions. Periscope enabled you to pull in data from a wide range of sources so you can combine all your data into one single platform to acquire compelling insights.
Advantages
- Pricing – Periscope offers a free trial, which enables businesses to buy before they try. You are also provided with a quote directly from the vendor which may be more cost-efficient.
- Access – Organisations can maximise the use of the platform as all teams can access it without having to pay for each user.
- Coding – You are not limited to one coding language as opposed to some other big players in data reporting. Developers can use the coding language of choice from SQL, Python or R or a combination of all three.
- Custom visuals – Periscope comes with a wide range of visualisations, however, what makes it stand out is you can create your own to suit your requirements.
Limitations
- Smaller platform – if you are looking to work with Periscope and don’t have the skills in house, you may find it difficult to find developers that are familiar with the technology as compared to Tableau and Power BI.
- Only web-based – The technology is not offered on mobile which restricts the user's access.
- Data integrations – Only a limited number of data integrations are available compared to other technologies.
Pentaho
Pentaho, formerly known as Kettle is an open-source business intelligence technology platform with a market share of 1.71% in data visualisation, according to Slintel. Although it has a small market share, Pentaho has many features which make it a winner for many organisations including one of our market research clients. There are several benefits it offers to organisations including simplicity and ease of use.
Ardent engineers have utilised Pentaho for a data integration project for a leading data science consulting client based in Bath, UK.
Here we will explore the advantages on offer and the limitations Pentaho presents.
Advantages
- Interactive, graphical user interface – easy to use UI allows a variety of users to effectively use the technology without any technical expertise.
- ETL Capabilities – One of the key benefits of Pentaho is the powerful extraction, transformation and ETL capabilities
- Mobile friendly – Pentaho supports both iOS and Android devices enabling users to access their data and reports on the go.
- Free trial – Pentaho offers a free trial enabling businesses to get a feel of the technology before investing.
- Real-time reporting – Users can access reports in real-time due to the in-memory caching.
Limitations
- The products offered as part of the Pentaho suite an inconsistent in the way they work, which can be complicated for users, especially when getting started.
- Analytics and corresponding data visualisations – the advanced analytics and visualisation could be improved when compared to the likes of Tableau.
- Pricing – The pricing is set at an annual fee where the subscription has to be renewed, there is not an option for perpetual licencing.
Ardent and data visualisation
At Ardent, our engineers have worked with all the technologies listed and have delivered exceptional data reporting and visualisation solutions to a wide variety of clients. One size does not fit all when it comes to technologies and business, therefore each technology offers unique benefits which make it a winner for our client solutions.
Ardent data reporting tool services
We understand that every business has unique needs, especially when it comes to thier data. Therefore, we offer a data reporting tool service where our team of expert engineers can build a data reporting tool tailored completely to your business and unique requirements.
If you are looking to leverage one of these popular data reporting and analytics technologies for your data visualization and reporting needs, then get in touch and Ardent engineers can come on board and provide seamless, implementation, integration and customisation.
Ardent Insights

Which Platforms Are Ahead in AI-Ready Data Pipelines?
At Ardent, we have spent years helping organisations design, modernise and operate the data foundations behind critical reporting, analytics and decision-making. That experience gives us a clear view of what now separates AI-ready businesses from those still struggling to get value from their data. It is not the amount of data they hold, or even [...]
Read More... from Popular data analytics and reporting tools

Making Your Existing Data Pipelines AI-Ready
From Stable Infrastructure to Adaptive Intelligence Most organisations do not need more data. They need their existing data to work better. At Ardent, we spend a significant amount of time inside large-scale client data platforms that are already mature, operational, and delivering value. These are not greenfield environments. They are complex ecosystems built over years, [...]
Read More... from Popular data analytics and reporting tools
AI-Powered ETL in Amazon Redshift
When the Warehouse Starts Doing the Work In our previous piece, we explored how ETL (Extract, Transform, and Load) is evolving into adaptive, intelligent systems. In Redshift environments, we are now seeing what that shift looks like in practice. For most of its life, Amazon Redshift has been treated as the final step in the [...]
Read More... from Popular data analytics and reporting tools
Services
About
UK
US
India

